More evidence 1/f LFFP “noise” indexes excitation/inhibition balance
September 5, 2017 by Bradley Voytek
Earlier this year my lab published a somewhat controversial claim: that a traditionally unmeasurable (in humans), but critical, aspect of brain functioning—the relative balance of neuronal excitation (E) and inhibition (I)—could in fact be inferred from the brain’s electrical activity. While there are methods (such as MRS) that can get rough E/I estimates in humans, those have no temporal resolution, they only measure where. Methods that do have temporal resolution require recording from single neurons, making large-scale measurements in humans impossible.
This is unfortunate, because there’s massive amounts of modeling and animal work that suggests E/I balance is critical for information gating, working memory maintenance, and so on, while E/I imbalances have been implicated in nearly every major neurological and psychiatric disorder, at this point.
Anyway, I’m particularly proud of this paper, “Inferring synaptic excitation/inhibition balance from field potentials,” published in NeuroImage (PDF), especially because the argument first arose out of some computational modeling that then informed the in vivo analyses.
One reason I love the paper is because it really was an effort by lab Cognitive Science PhD student Richard Gao and former post-doc Erik Peterson to try and figure out, physiologically, what was driving the results I’d found in my 2015 J Neurosci paper “Age-related Changes in 1/f Neural Electrophysiological Noise” (PDF), and to put to the test some assertions I’d made in my 2015 Biol Psychiatry review, “Dynamic network communication as a unifying neural basis for cognition, development, aging, and disease” (PDF). My lab wasn’t satisfied with my arguments, so we shifted gears a bit and really decided to nail this thing down.
What we found is that the 1/f “noise” in the LFP/ECOG signal actually reflects balance of the E/I inputs to that region, due to the fact that excitatory glutamate and inhibitory GABA currents that dominate the LFP/ECOG have different temporal profiles that manifest in the frequency spectra in stereotypical ways. Specifically, more excitation leads to a “flatter”1/f while more inhibition leads to a more negatively-sloped 1/f.
In spite of (or perhaps because of) my love for this paper, I’m always trying to find evidence to discredit or temper my enthusiasm. Even though we had supporting evidence from modeling, as well as from publicly available recordings from rat hippocampus LFP and macaque cortical ECOG, we’re making quite a bold claim, and of course extraordinary claims require extraordinary evidence.
A paper posted to bioRxiv this week by Simon Farmer’s group, and lead by Timothy West, at UCL caught my attention. This paper, “Propagation of Beta/Gamma Rhythms in the Cortico-Basal Ganglia Circuits of the Parkinsonian Rat,” is amazing because they simultaneously recorded the ECOG and LFP from multiple different parts of the motor basal ganglia circuit. This piqued my interest, because this circuit is pretty well understood, with each part of it getting different amounts of excitatory and/or inhibitory input, with the concomitant E/I changes pretty well understood in Parkinson’s disease.
Back in 2006 I published a mini-review in J Neurosci called “Emergent Basal Ganglia Pathology within Computational Models”, that shows this circuit in healthy and Parkinsonian brains:
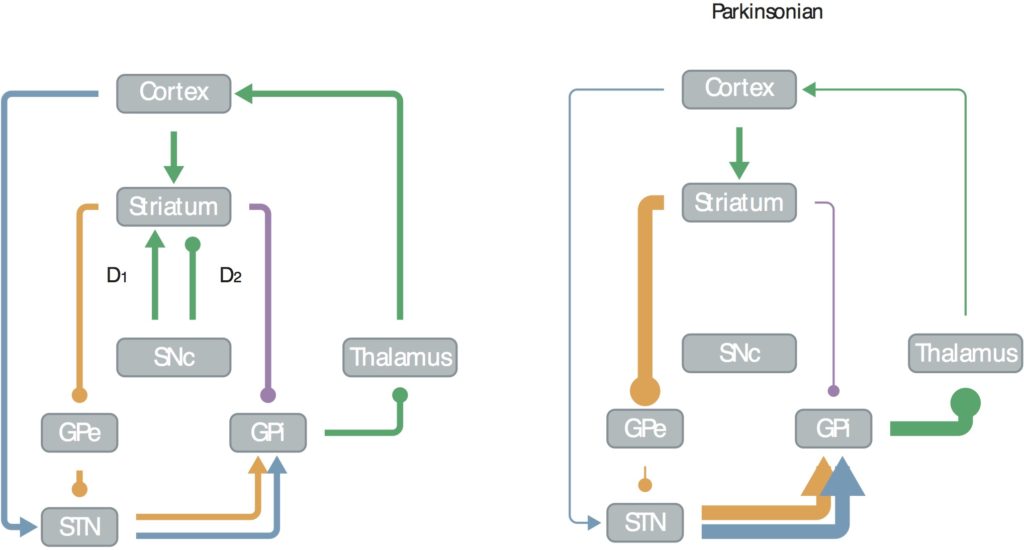
In this, figure, arrows indicate excitatory inputs, dots inhibitory. You can see that in the healthy state (left) the subthalamic nucleus (STN) gets excitatory inputs from the motor cortex, the striatum gets mixed, the external globus pallidus (GPe) gets inhibitory, and the motor cortex excitatory from the thalamus (though it’s strongly inhibited at rest).
In Parkinson’s disease, the striatum loses nigral (Snc) inputs, shifting its balance toward over-excitation from the cortex, over-inhibiting the GPe, reducing excitation to the cortex, making it more difficult for people with Parkinson’s disease to initiate movements.
Check out the power spectra from the West pre-print:

As predicted by our 1/f-reflects-EI model, and known basal ganglia circuitry, the motor cortex ECOG (purple) is the most negatively-sloped (thus, most inhibitory), which makes sense given the rats are anesthetized here (this replicates the macaque cortical ECOG from our NeuroImage paper). In the 6-OHDA lesioned animals (a model for Parkinson’s disease, right) the motor cortex appears to be even more inhibited, also following our EI predictions and the known circuitry.
EI balance is slightly shifted toward E, though still more inhibitory, in the GPe (blue and green), which again makes sense as the GPe gets massive inhibitory inputs. Then the striatum (STR) gets mixed EI, so it’s less sloped and more flat while the STN, which gets mostly excitatory inputs, is the most flat which, in our model, suggests this EI balance is tipped most toward E.
Importantly, this STR/STN dynamic changes in Parkinson’s where the loss of nigral input shifts the STR to over-excitatory. Note in the spectra that the flattest (and thus most excitatory) are no longer STN, but STR.
This is awesome!
These results are exactly what we would predict if, indeed, the 1/f slope indexes EI balance, given both the known basal ganglia circuitry, the state of the animal (anesthetized), and the effects of Parkinson’s disease on that circuit.
Score one for computational modeling!